Reducing the incidence of grand claims
This is the second post in our series critiquing the new booklet "The Science of Immunisation", from the Australian Academy of Science. Here Greg Beattie takes a look at the opening statement from the summary.
"The widespread use of vaccines globally has been highly effective in reducing the incidence of infectious diseases and their associated complications, including death."
- The Science of Immunisation (Australian Academy of Science)
The claim here is that vaccines reduced cases of infectious disease, and therefore, associated death and disability. This sounds good. It may or may not be true, but it certainly sounds good. One would expect it to be backed with solid evidence. Let's have a look.
DEATHS A good part of this has already been dealt with in a recent post by Meryl Dorey. Death-rates in Australia from some of the diseases we vaccinate against were discussed in the post, however, much more Australian data can be viewed in the following four posts I made to a debate on the issue:
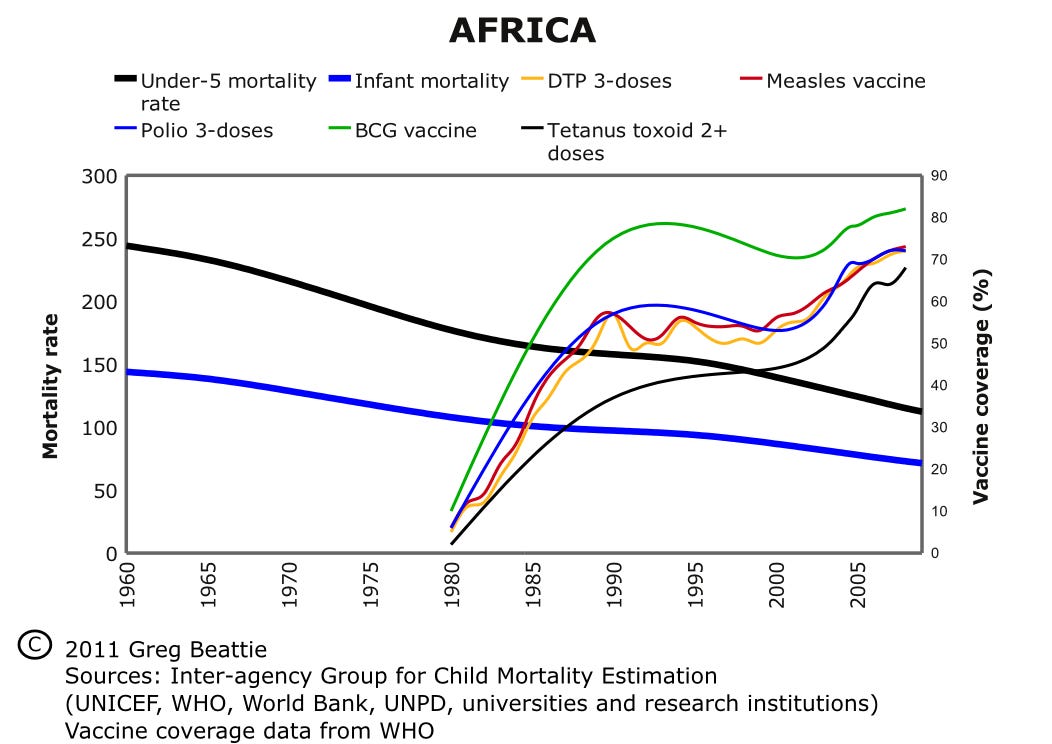
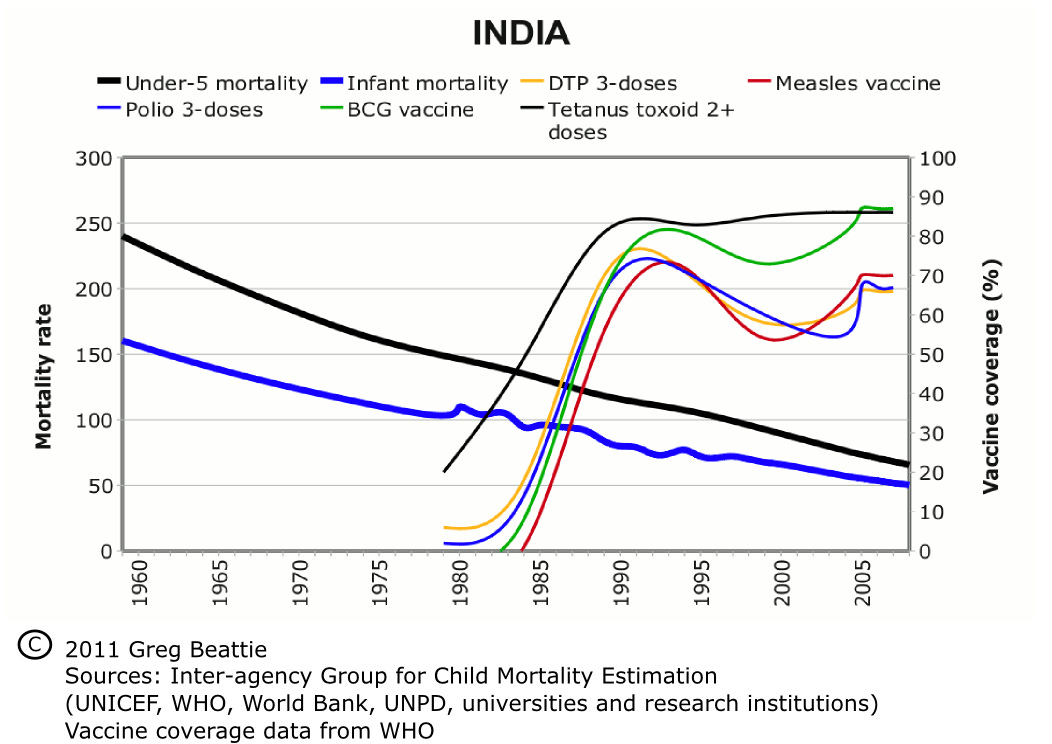
Death graphs for USA and England can be found HERE, as well as HERE. But what about developing nations? Well, it's a bit trickier. Where Australia, USA, England, and Europe have meticulously recorded all deaths (and their causes) since the mid 1800s, the story was entirely different in the developing world. Deaths were rarely recorded. Even when they were there was virtually no information on what caused them. The World Bank overcame this missing data to an extent by conducting sample surveys over the past half century. These surveys estimate the infant mortality rate and the under-5 mortality rate. Here's what they show in Africa and India:

Child death rates versus vaccination, Africa.

Child death rates versus vaccination, India As we can see, the big push for vaccines from the 1980s onward (the finer lines shooting upward) appears to have had little if any effect on the trend in death rates in children (the two thick lines running from left to right). After viewing all the above my guess is you'll feel we have little reason to credit vaccines with any role in saving lives. You're free, however, to come to your own conclusions about that. INCIDENCE But what about incidence? That is, the number of cases of the illness, regardless of whether the affected person died. Did vaccines reduce this? The answer is... who knows? It's actually impossible to tell: at least, not statistically. To explain, I'll start by taking you back, almost 70 years, to a special book written by Darrell Huff. Regarded as one of the biggest selling books on statistics ever, "How to Lie with Statistics" was commonly used as an introductory textbook for statistics students. It covers most of the pitfalls that await us when confronted with claims based on sample statistics. And what are 'sample statistics'? Well, that's what we work with when we don't have the resources to measure the whole population. We take a sample and extrapolate our findings to the wider population. With deaths, we don't use 'samples' because we are working with the whole set. As mentioned above, all are recorded (except in developing countries). With 'cases' of illness, however, it's impossible to work with the whole set. No one knows how many cases of illness occur. We can only take a sample. Of course it's important that our sample is representative: that is, it represents the whole population. We'll have a look at this shortly, but first, let's see what Huff had to say about sample statistics:
"The 'population' of a large area in China was 28 million. Five years later it was 105 million. Very little of that increase was real; the great difference could be explained only by taking into account the purposes of the two enumerations and the way people would be inclined to feel about being counted in each instance. The first census was for tax and military purposes, the second for famine relief."
This was one of many examples he used to illustrate problems frequently lurking behind grand statistical claims. Huff takes us through the things we need to keep in mind, including non-representative samples and biased or poorly collected data, all of which lead to erroneous conclusions. He urges us to take a close look. Is the sample a true representation of the population, or is it skewed? Are the measurements free of bias? Are the investigators free of bias? Regarding 'incidence' data, he tells us:
"Many statistics, including medical ones that are pretty important to everybody, are distorted by inconsistent reporting at the source. There are startlingly contradictory figures on such delicate matters as abortions, illegitimate births, and syphilis. If you should look up the latest available figures on infuenza and pneumonia, you might come to the strange conclusion that these ailments are practically confined to three southern states, which account for about 80% of the reported cases. What actually explains this percentage is the fact that these three states required reporting of the ailments after other states had stopped doing so. Some malaria figures mean as little. Where before 1940 there were hundreds of thousands of cases a year in the American South there are now only a handful, a salubrious and apparently important change that took place in just a few years. But all that has happened in actuality is that cases are now recorded only when proved to be malaria, where formerly the word was used in much of the South as a colloquialism for a cold or chill."
Then there's polio. Here's what Huff had to say about polio figures BEFORE the first polio vaccine came into use:
"You may have heard the discouraging news that 1952 was the worst polio year in medical history. This conclusion was based on what might seem all the evidence anyone could ask for: There were far more cases reported in that year than ever before. But when experts went back of these figures they found a few things that were more encouraging. One was that there were so many children at the most susceptible ages in 1952 that cases were bound to be at a record number if the rate remained level. Another was that a general consciousness of polio was leading to more frequent diagnosis and recording of mild cases. Finally, there was an increased financial incentive, there being more polio insurance and more aid available from the National Foundation for Infantile Paralysis. All this threw considerable doubt on the notion that polio had reached a new high, and the total number of deaths confirmed the doubt."
Of course Huff couldn't know the fate that awaited polio notifications afterward. The first polio vaccine was introduced in the same year the book was published, and after a few years in which polio numbers rose (yes, you read that correctly) the case definition for the illness was changed. It became more restrictive. This was the first of a series of revisions which led to a drop in cases being notified. This rendered the data gathered prior to the changes totally irreconcilable with that gathered after. Huff's conclusion:
"It is an interesting fact that the death rate or number of deaths often is a better measure of the incidence of an ailment than direct incidence figures -- simply because the quality of reporting and record-keeping is so much higher on fatalities. In this instance, the obviously semiattached figure is better than the one that on the face of it seems fully attached."
So what exactly are 'incidence' figures? How did we collect them, and why were there so many problems with them? Well, all good questions. Basically, we don't have true incidence data. Instead we use something quite different, called notifications. We asked doctors to 'notify' certain illnesses when they saw them, so we could track cases. In other words, we asked them to send a record to their local health authority whenever one of their patients turned up with what looked like one of the diseases. But for a start, one obvious problem is these 'notifications' only included cases which visited a doctor. In the USA it's been estimated only 3% of adult whooping cough cases are reported to the system. But even more concerning, doctors didn't always consider it important to report cases they did see. One study in the USA, where reporting is mandated by law, found the rate ranged from 9% to 99%. The likelihood of a case being reported to the system depended largely on publicity. Notifications had one purpose only: to enable a quick response to outbreaks. They were never meant to be used for retrospective assessment the impact of vaccination programs. One only needs to look at the history of whooping cough notification in Australia to confirm this. When mass vaccination for whooping cough commenced in the 1950s ALL STATES except South Australia stopped collecting notifications. Why would health authorities stop collecting figures which were supposed to record the great change? But there are other major problems with the data. Some of these also apply to deaths figures, although to a lesser extent. First there was the problem of diagnosis. Doctors could seldom be sure which illness their patients had. Often it was a choice between whooping cough and bronchiolitis, croup or whatnot. Or between measles and roseola, rubella, rocky mountain spotted fever, and a host of others. To complicate matters doctors were taught to use the vaccination status of a patient to help them make the decision. Textbooks would encourage them to diagnose other illnesses if the patient had been vaccinated. Governments (through their health bureaucracies) also encouraged this, and continue to do so. In this example the UK National Health Service exhorts doctors to check the patient's vaccination history before diagnosing measles, mumps, rubella and whooping cough. This is a no-no in statistics. It's a cut and dried example of bias, obviously slanting the data and supporting the notion that vaccines reduced case numbers. How much did it slant the data? We'll never know. All we know is it's one of those big problems Huff warned us about. Finally there was the problem of changing case definitions, as mentioned above with polio. We hear a lot about laboratory confirmation nowadays, but it wasn't always so. For example, prior to the 1990s measles was diagnosed clinically: that is, it was decided after physical examination by a doctor. Since then, however, a measles case needed to be tested in a laboratory to 'prove' it was measles. When inexpensive testing first became available during the 1990s it was found that only a few percent of the cases initially diagnosed as measles passed the test ( link http://nocompulsoryvaccination.com/2010/10/17/lies-damned-lies-and-statistics/ ). Again this led to the impression something had brought about a 'real' decline in measles. In summary, it is perhaps impossible to know how much, if at all, vaccination influenced the rates of infectious disease. However the claim that it has substantially done so forms the backbone of the whole case for vaccination. Death trends appear to offer no support for this claim, and we have no properly collected incidence data. Without good evidence we're left with little reason to vaccinate our children or ourselves. Greg Beattie is author of "Vaccination: a Parent's Dilemma" and "Fooling Ourselves on the Fundamental Value of Vaccines". He can be contacted via his website: www.vaccinationdilemma.com


