Intellectual dishonesty?
After my blog yesterday which showed graphs plotted from government figures in Canada and the UK, that show the precipitous decline in both the incidence and mortality from measles prior to vaccination, I have received a barrage of comments from people telling me that the graphs are not a true representation of what occurred.
In one way, they have a point. For some reason, Dr Obomsawin 'smoothed' the curve (normally called a spline or the line of best fit - a commonly-used scientific method of representing data in a graph) so that instead of seeing the normal 2-3 year ups and downs of measles, we simply see a straight downward motion.
I don't accept the claims of these most strident critics who say that the smoothing of this curvemeans that the information is incorrect. Wishing it were so, and stating it is so does not make it so.
The FACT is that in 1935 when this graph began, there were approximately 780 cases of measles per 100,000 Canadians being reported each year. In 1959, 4 years before the introduction of the measles vaccine, there were approximately 40 cases of measles reported per 100,000.
In other words, the incidence of measles declined by 95% BEFORE the vaccine was introduced. We can argue up and down - backwards and forwards - sideways and frontways - about whether or not these graphs display the situation properly or simply artistically. But the depiction of this situation in these graphs does not change the fact that measles vaccination had NOTHING to do with the decline in either the incidence of or the deaths from measles.
The decline in deaths was even more dramatic (and parallels that decline as seen in Australia, the US, the UK and every other developed country prior to the introduction of the measles vaccination).
According to official government statistics, the second graph I posted yesterday shows that approximately 1,160 children under the age of 15 died from measles in England and Wales in the year 1850. By 1959 - again, 4 years before the introduction of a vaccine for measles, less than 10 children under 15 were dying from measles in that area. In other words, the death rate had declined by well over 99% BEFORE the vaccine was introduced.
Let me repeat that. The measles vaccination had absolutely NOTHING to do with the decline in measles disease since the incidence had already fallen by 95% before the vaccine was introduced and deaths from measles were so rare as to be negligible when compared to most other causes of neonatal and child mortality. What makes this an even more dramatic decline is the fact that this figure does not take into account the huge increase in the population during this time.
Critics of the AVN have accused us of intellectual dishonesty for using the first of Dr Obomsawin's graphs on measles incidence. They claim that since the Canadian government stopped keeping track of measles incidence from 1959 until 1968, this graph should have a gap through those years. But if you look at the graphs, you will see that there is a straight line to indicate this situation. The line starts where the incidence stopped being tracked and picks up in 1968 where Canada was once again collecting data on measles disease. This is an accurate way to show that these figures are not available though perhaps, in retrospect, Dr Obomsawin might have been better off to have included this information in his footnotes.
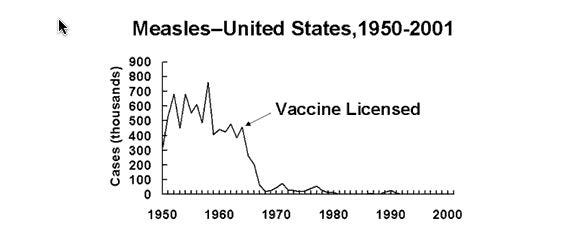
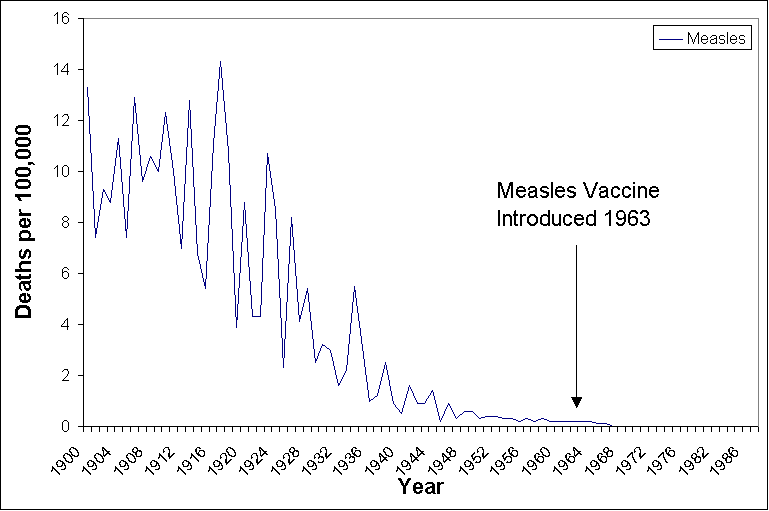
In fact, it is the government that can and should be accused of intellectual dishonesty for the way in which they depict the decline of measles (and other so-called vaccine-preventable illnesses). Look at the following two graphs - both demonstrating the decline in measles disease - the first, from the Centres for Disease Control, uses the incidence of measles - the second, deaths.
In the first graph, we see the picture that is shown to doctors who are in training; the public; and others who are being directed to see the what the government and the medical community want them to see - the disease was common, the vaccine was licensed and hey, presto! the disease plummeted. Success story without a doubt.

The next graph demonstrates how we have been manipulated into this belief system. The first graph starts a few years before the introduction of the vaccine. It appears to show a very strong cause-effect relationship between vaccination and the decline in measles. Nothing could be further from the truth, however, as you can see from the next graph:

Here, you can see that when you go back to the turn of the century, that blip in measles that took place around 1950 doesn't quite look so big in the grand scheme of things, does it (both of these graphs are from the US)? In fact, you can see that just like in the UK, the death rate from measles declined by 99% BEFORE the vaccine was introduced.
Why are our health professionals being given such deceptive and misleading information by those who are supposed to be preparing them for the important work they need to do caring for their patients? Do you think that perhaps, if they were given access to accurate data such as what is shown in the second graph above, they might not be quite so willing to push patients into vaccinating? That would be very inconvenient, wouldn't it?
Rather then criticising these graphs for demonstrating so well the fact that measles had declined so obviously before measles vaccination, one would think that anyone concerned with science would have to wonder why - when the Canadian government knew that release of a vaccine against measles was imminent (work had started on this shot in the mid-1950s - right around the time the polio vaccine was being released), it chose to discontinue reporting of measles incidence. This decision - which was mirrored in Australia - could lead a person to suspect that this omission may have been made deliberately to reduce speculation as to the necessity of this shot.
Perhaps it is time to stop criticising those who reveal the inconvenient truths about vaccinations and to start being honest about the fact that vaccines are not scientifically tested, haven't been shown to lead to a decline in infectious diseases and do cause serious reactions and death in a susceptible sub-group of the population. In other words - stop lying and start telling the truth.


